Key facts
- The analysis identified slow magnetoacoustic waves as the driver of dynamic fibrils, supported by the similarity between fibril and running penumbral wave periods.
- The research team identified 176 dynamic fibrils around the sunspot.
- The analysis found that deceleration rose with maximum velocity, with a Spearman coefficient of 0.71, which aligns with shock-driven interpretations.
- Fibrils above more vertical magnetic fields showed larger decelerations and shorter periods, while those above more horizontal fields showed the opposite pattern.
Researchers from the Yunnan Observatories of the Chinese Academy of Sciences studied dynamic fibrils around NOAA active region 13182 at S15E11 using New Vacuum Solar Telescope data captured on Jan. 10, 2023, and published the results in The Astrophysical Journal on Nov. 10, 2026.
What dynamic fibrils are
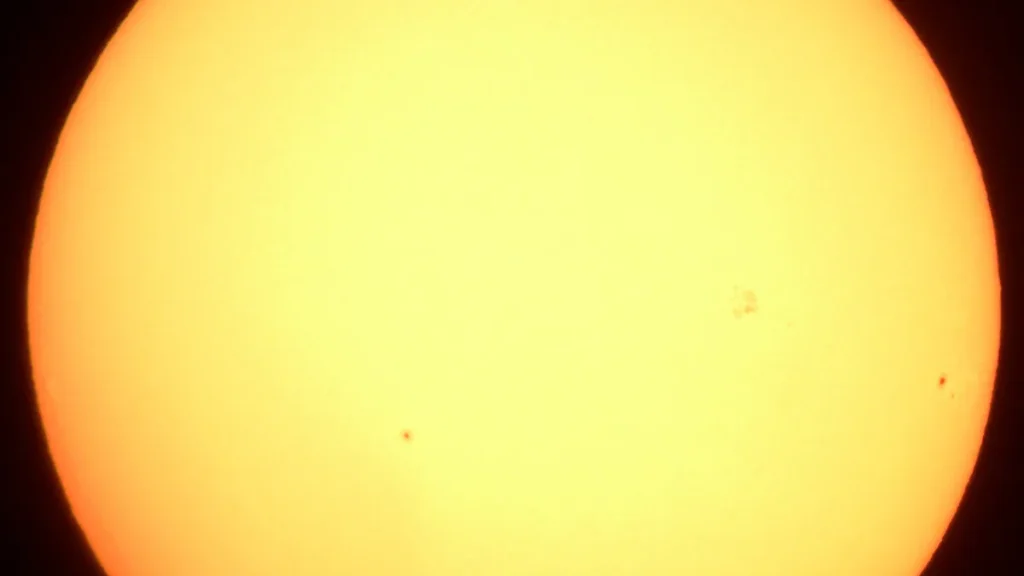
Dynamic fibrils are small-scale, elongated chromospheric structures in solar active regions, shaped like jets and marked by periodic up-and-down motions. Researchers described them as the active-region counterparts of spicules seen at the solar limb and mottles seen on the disk. The 176 fibrils in this study spread from the penumbra out to the superpenumbra surrounding a mature negative-polarity sunspot with a distinct umbra and penumbra. A full-disk H-alpha image from the Chinese H-alpha Solar Explorer placed the active region at S15E11, showing a developed sunspot structure suitable for fibril statistics.
Scientists identified the fibrils from up-and-down motions in H-alpha images and distinct parabolic tracks in time-distance diagrams. Of the 176 events, 132 showed single-parabolic motion and 44 showed multiple-parabolic motion, with multiple-parabola events defined as at least two consecutive parabolic motions separated by no more than two frames. In the study’s figures, single-parabola events appear as blue crosses and multiple-parabola events as red crosses, visually separating the two motion classes across the sunspot.
How NVST isolated the wave driver
The New Vacuum Solar Telescope, equipped with an adaptive optics system to reduce atmospheric seeing, observed the region from 04:39:40 to 05:50:52 UT on Jan. 10, 2023. The team paired those H-alpha observations with Solar Dynamics Observatory extreme-ultraviolet images from seven wavebands and vector magnetic field measurements from the Helioseismic and Magnetic Imager. “The observations analyzed in this study cover the period from 04:39:40 to 05:50:52 UT on 2023 January 10.” — arXiv paper.
Wavelet and Fourier analysis of the fibril trajectories found a dominant oscillation period of 287 seconds, while running penumbral waves showed a dominant period of 263 seconds. The close match led researchers to identify slow magnetoacoustic waves as the driver of dynamic fibrils, supported by the similarity between fibril and running penumbral wave periods. Wavelet cross-power analysis showed strong coherent power above the 95 percent confidence level outside the cone of influence, with a mean phase lag of minus 64 degrees for the fibril event relative to the waves.
For one multiple-parabola event near the umbra-penumbra boundary, researchers traced six parabolic motions and used wavelet cross-power analysis to measure phase differences from minus 135 degrees to 5 degrees. Assuming an illustrative distance of one megameter, a 64-degree phase and 275-second period yield an estimated phase speed near 20 kilometers per second, though the paper stresses this is an estimate rather than the true wave speed. This event sat near the umbra-penumbra boundary, where running penumbral waves travel outward and reach the starting points of the parabolic trajectories.
The analysis also revealed that fibrils above more vertical magnetic fields showed larger decelerations and shorter periods, while those above more horizontal fields showed the opposite pattern. Researchers suggested the difference may come from magnetic field inclination affecting the acoustic cutoff frequency, which controls slow magnetoacoustic wave propagation, a relationship consistent with numerical simulations showing long-period waves favoring strong, inclined fields.
What the motion reveals
Kinematic fits to parabolic paths gave an average deceleration of 120 plus or minus 43 meters per second squared, a peak velocity of 15.9 plus or minus 4.5 kilometers per second, a maximum length of 1.13 plus or minus 0.48 megameters, and a typical duration of 270 plus or minus 63 seconds. Deceleration ranged from 45 to 235 meters per second squared, below the Sun’s gravitational acceleration of 274 meters per second squared, while peak velocities ran from 8.7 to 31.5 kilometers per second, exceeding the local chromospheric sound speed and permitting shock formation.
Because deceleration fell below solar gravity, the authors explain the motion as plasma traveling along inclined magnetic fields where only the projected component of gravity acts along the field direction. Kinematic parameters come from fitting parabolic functions to trajectories in time-distance diagrams, and the measured values are projected components on the plane of the sky. Single-parabola and multiple-parabola events showed consistent kinematic properties, with single events averaging 118 plus or minus 42 meters per second squared deceleration and multiple events averaging 127 plus or minus 46.
Peak velocities averaged 15.8 plus or minus 4.6 kilometers per second for single events and 16.2 plus or minus 4.4 for multiple events. Maximum length averaged 1.14 plus or minus 0.51 megameters for single events and 1.11 plus or minus 0.39 for multiple events, while duration averaged 272 plus or minus 65 seconds for single events and 264 plus or minus 56 seconds for multiple events. The full length range spans 0.38 to 3.42 megameters, and the full duration range spans 135 to 450 seconds.
The average fibril duration is comparable to the five-minute period that dominates chromospheric penumbral oscillations, linking fibril lifetimes to the surrounding wave environment. The average fibril lengths are comparable to typical dynamic fibril and spicule lengths reported in earlier observational work.
A positive correlation between deceleration and maximum velocity, with a Spearman coefficient of 0.71, aligns with shock-driven interpretations. Deceleration correlated negatively with duration at rho minus 0.55, maximum length correlated positively with duration at rho 0.69, and maximum velocity correlated positively with maximum length at rho 0.70. For single-parabola events, the period is estimated as two times maximum velocity divided by deceleration, while multiple-parabola event periods come from wavelet analysis of the trajectories.
Initial velocities above the local chromospheric sound speed mean the upward-moving plasma can steepen into shocks, matching the impulsive acceleration followed by near-constant deceleration seen in simulations. According to earlier numerical simulations, the significant correlation between deceleration and peak speed stems from shock wave-driven chromospheric jets, strengthening the shock-driven reading of fibril motions.
Why energy transport matters
Multiwavelength observations revealed fibril signatures extending from the chromosphere through the transition region into the corona, suggesting these structures may help transport energy and heat the solar atmosphere. Earlier H-alpha and Ca II observations showed distinctive Doppler shifts, with fibrils shifting blue while moving upward and red while moving downward. Enhanced transition-region emission has been linked to chromospheric shocks, and Solar Orbiter detected coronal counterparts as small bright blobs with parabolic motion.
The Doppler signal is estimated from the intensity difference between the blue and red wings of the H-alpha line, which sit at minus 0.6 angstroms and plus 0.6 angstroms and serve as a proxy for line-of-sight velocity. Magnetic field inclination is calculated as the angle relative to the local normal direction, spanning zero degrees for vertical fields to 90 degrees for horizontal fields. This Doppler behavior agrees with earlier Ca II observations that used different line-wing positions to trace phases in fibril evolution.
The physical picture begins with oscillations from the photosphere leaking into the chromosphere along inclined magnetic flux tubes, where they turn into shocks that drive jet-like motions. Slow magnetoacoustic waves can be excited by convective motions in and around magnetic flux concentrations, and as they travel upward through the stratified atmosphere their amplitudes rise rapidly with falling density until they steepen into shocks.
The study offers new observational evidence for how small-scale chromospheric activity forms and how energy moves through the solar atmosphere, while demonstrating the New Vacuum Solar Telescope’s value for resolving fine solar features. The authors note that direct observational evidence for the shock mechanism has been limited and that fibril responses across atmospheric heights need further clarification, which this statistical study addresses.
Publication and funding
The Astrophysical Journal published the study on Nov. 10, 2026. “The study was published in The Astrophysical Journal on Nov. 10.” — Phys.org report. Funding came from the CAS Strategic Priority Research Program, the National Key R&D Program of China and additional programs. “This work was supported by the CAS Strategic Priority Research Program, the National Key R&D Program of China and other programs.” — english.cas.cn.


Join the discussion