Key facts
- ESA published the first land- and sea-surface temperature images from the Sentinel-3C Sea and Land Surface Temperature Radiometer on 18 November 2026, covering Western Australia and Spain.
- Copernicus Sentinel-3 is implemented by the European Commission, ESA and EUMETSAT, with ESA developing satellites and EUMETSAT operating the routine phase.
- The radiometer's primary role is measuring sea and land surface temperatures, and it has two dedicated channels for detecting and monitoring wildfire intensity.
- The thermal infrared and shortwave infrared channels have been enabled after an earlier visible-light image, and the instrument is working well before full commissioning.
On 18 November 2026, the European Space Agency released the first thermal pictures showing land and sea temperatures from the Sentinel-3C radiometer, with coverage over Western Australia and Spain. The agency said the imagery shows thermal views together with visible and shortwave infrared views over land and seas around those regions, marking an operational milestone for the Copernicus Earth observation programme.
The Sentinel-3C spacecraft began its mission on 15 September 2026, carrying four scientific instruments among them the radiometer. According to ESA, the Sentinel-3 mission gathers data on oceans, land, ice and the atmosphere for Copernicus services, and the third satellite in the series carries four instruments.
Thales Alenia Space built the spacecraft, which weighs approximately 1,143 kilograms (2,520 pounds), and gave it an identical instrument suite covering OLCI, SLSTR, SRAL and MWR. The satellite travels a sun-synchronous path at roughly 820 kilometres (510 miles) altitude and 98.6-degree inclination, flying alongside FLEX and crossing each point at the same local solar time on every orbit. Images from the ocean and land colour instrument and synthetic aperture radar altimeter were published last month.
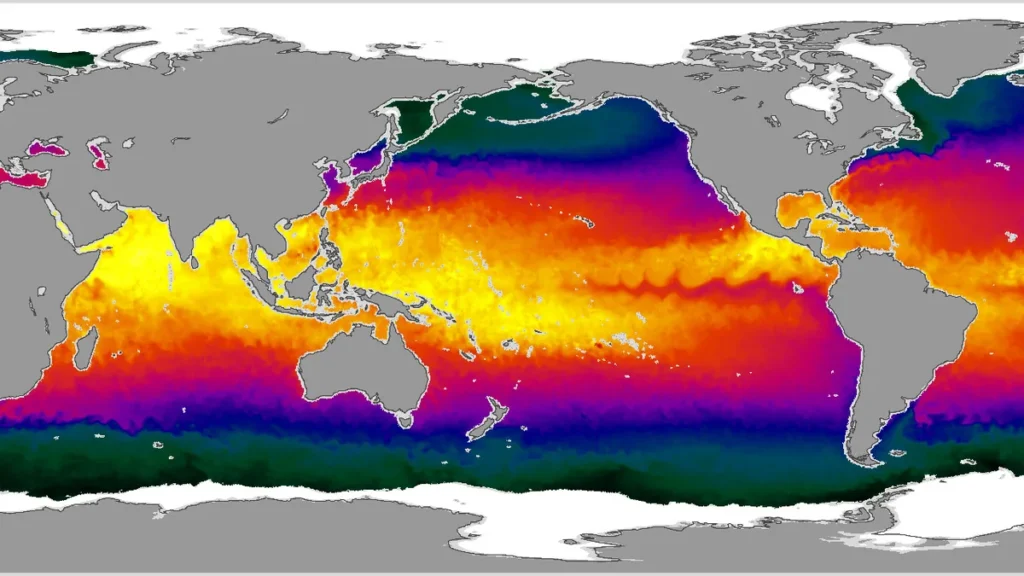
The instrument sees in nine spectral bands spanning visible, shortwave infrared and thermal infrared wavelengths. SLSTR mainly measures sea and land surface temperatures, while two dedicated channels detect and monitor wildfire intensity. In September 2026, ESA said the radiometer gauges global sea surface temperatures within 0.3 degrees Celsius (0.54 degrees Fahrenheit). On 18 November 2026, ESA explained that the thermal infrared channel records top-of-atmosphere radiation as brightness temperature, which may not match physical land or ocean temperatures.
The thermal picture of Western Australia was taken on 4 November 2026 over the Kimberley, with Broome, the Dampier Peninsula and the Rowley Shoals in view. Much of the inland area tops 40 degrees Celsius, the northern coast stays at 35 degrees Celsius or below, and the eastern Indian Ocean reads about 20 degrees Celsius. Australia’s Bureau of Meteorology ties the Western Australia heatwave and wildfires to the El Niño climate cycle, which usually brings drought to Indonesia in the current event.
On 2 November 2026, the thermal view of southwestern Europe and North Africa showed southern Portugal and Andalusia in the mid to high 20s degrees Celsius, with Morocco and the northern Algerian coast above 30 degrees Celsius. False-colour images mixing visible and shortwave infrared light render vegetation in red and wildfire burn scars in dark brown, including scars west of Madrid and near Bordeaux. ESA says the false-colour view combines visible and near infrared channels to show vegetation density in red and inland burn scars in dark brown, and that the shortwave infrared channel identified European burn scars after summer heatwaves.

EUMETSAT issued preliminary thermal infrared views of north-west Australia on 4 November 2026 at 01:34 UTC, of Greenland-Iceland sea and ice on 31 October 2026, and of Sulawesi fire hotspots on 31 October 2026. The shortwave infrared channel responds to strong fire heat and burned ground, and dozens of active fires burned across the Kimberley that morning, while the thermal channel shows ocean swirls where the West Australian Current meets the South Equatorial Current. SLSTR looks straight down and then back through more atmosphere in a dual view, improving sea and sea-ice temperature accuracy, while EUMETSAT brought out a sea-ice surface temperature product earlier in 2026. Only a small portion of each one-kilometre thermal infrared pixel used by the SLSTR fire channels holds actively burning fires.
Sentinel-3C data reach every part of the planet and can arrive at users within three hours of collection, with streams continuing into the 2030s. After commissioning finishes, Sentinel-3C will assume Sentinel-3A’s duties, although some Sentinel-3A observation capabilities will stay operational. ESA continues to prepare Sentinel-3C for full operation, with commissioning expected to last another five months. Once commissioning ends, ESA and EUMETSAT will share management of Sentinel-3, with EUMETSAT running routine operations and marine and atmospheric observations and ESA supplying land, cryosphere, inland water and atmospheric products.
The European Commission, ESA and EUMETSAT implement Copernicus Sentinel-3, with ESA developing the satellites and EUMETSAT running the routine phase. Sentinel-3C adds to the constellation instead of replacing Sentinel-3A and Sentinel-3B, which strengthens data continuity. Sentinel-3A lifted off from Russia’s Plesetsk Cosmodrome in Feb. 2016 and Sentinel-3B followed in Apr. 2018, both riding Rockot vehicles, and Sentinel-3A has worked for more than a decade past its seven-year design life. Satellite measurements show global sea levels climbing by an average of 3.64 millimeters per year since 1999, or 0.14 inches, and the rate is accelerating.
Copernicus Sentinel-3 data help monitor land and sea surface temperatures for climate research, marine conservation and extreme heat event assessment. The thermal infrared and shortwave infrared channels were switched on after an earlier visible-light image, and the instrument performs well ahead of full commissioning. On 18 November 2026, ESA said thermal and shortwave infrared bands, invisible to human eyes, reveal soil moisture, plant health, wildfire damage, geological mineral composition and atmospheric gases.


Join the discussion